

Table of Contents
- Why DAT Rates Alone Don't Tell You What a Load Really Pays
- The Hidden Costs DAT Doesn't Show: Deadhead, Fuel, and Time
- How Owner-Operators Lose Money on High-Rate Loads
- The Math Behind True Profitability: Rate Per Total Mile vs. Gross Rate
- What KRYSTAL Does That Load Boards Cannot
- Building Your Operating Profile: The Foundation of Accurate Load Decisions
- Using KRYSTAL to Evaluate a Load From Your Cab in Minutes
- Lane Scoring and Broker Risk: Making Smarter Counter-Offers
- Comparing Real Economics Across Your Fleet
- Getting Started: Free Load Analyses Before You Commit
- Frequently Asked Questions (FAQ)
Why DAT Rates Alone Don't Tell You What a Load Really Pays
Every day, owner-operators and small fleet managers face the same decision: accept or reject a load offer in minutes, often from the cab with limited data. A broker sends a rate, DAT shows the lane history, and you have to decide. The problem is straightforward: a high gross rate can mask a terrible profit margin once you factor in the real costs of running that load. We built KRYSTAL to solve this exact problem by doing the math that load boards cannot.
DAT Freight and other load boards excel at showing you available freight and historical rates for a lane. What they don't show you is what that freight actually pays you after accounting for the specifics of your business and truck. A $2,500 load from Chicago to Atlanta looks different depending on whether you run a 6-mpg refrigerated unit or an 8-mpg dry van, whether you've got a return load lined up, and what your fuel and insurance costs really are.
The rate quoted by a broker is a gross number. It doesn't subtract fuel, it doesn't account for the miles you'll deadhead to pick up the load, and it doesn't reflect the time your truck will spend in detention or waiting for a dock. What DAT shows you is the starting point of the conversation, not the ending point of your profit calculation.
Owner-operators who rely solely on DAT rates and mental math often accept loads that look profitable on the surface but leave money on the table. The load board tells you the rate; it doesn't tell you whether that rate makes financial sense for your specific operation.
What to do next: Write down the last five loads you hauled. For each one, note the gross rate, the total miles driven (including deadhead), your actual fuel cost, and the hours spent waiting or in detention. Calculate your real net profit on each. You'll likely discover that the biggest-looking numbers weren't the most profitable.
The Hidden Costs DAT Doesn't Show: Deadhead, Fuel, and Time
Three costs consistently surprise owner-operators when they do the full math: deadhead miles, actual fuel consumption, and uncompensated time.
Deadhead is the empty-mile drive to pick up a load or reposition after delivery. A 450-mile load might require 80 miles of empty running to get to the shipper, instantly converting your rate into a lower rate per total mile. DAT shows how far the pickup is from you, but its rate per mile is figured on loaded miles only; it doesn't turn those empty miles into a cost for your truck. If you're deadheading 80 miles to make a 450-mile run, your cost per mile spreads across 530 miles, not 450.
Fuel cost is brutal. A dry van running 6.5 mpg with diesel at $6.50 a gallon costs about $1.00 per mile just for fuel. Many owner-operators use an average fuel cost, but fuel varies by region, season, and truck condition. Diesel in California regularly runs well above the national average, so the same miles can cost noticeably more to fuel out West than in the Midwest. A load that pencils out at break-even in Texas might lose money in Connecticut.
Time spent waiting, in detention, or at a dock doesn't generate revenue but costs money. An extra 10 hours waiting for dock access on a load that pays $0.90 per total mile erases profit fast. If your cost per hour to sit is $35 (truck payment, insurance, maintenance, divided by operating hours), that's $350 in uncompensated cost. The broker won't show you the dock history for that shipper, and DAT won't calculate the time cost.
These three expenses combined can flip a load from profitable to unprofitable, and none of them are baked into the gross rate you see on a load board.
What to do next: Pull your last fuel receipts and maintenance logs. Calculate your actual cost per mile for fuel, tires, oil changes, and repairs over the past three months. Be honest about your truck payment, insurance, and all operating expenses. You now have your true cost baseline.
How Owner-Operators Lose Money on High-Rate Loads
The paradox at the heart of freight decisions is that the highest gross rates often hide the worst margins. A $3,500 load sounds fantastic until you do the math and realize it costs you $3,200 to haul it, netting only $300 for a week of work.
Here's how this happens in practice:
You see a posted load: $2.10 per mile, 500 loaded miles, $1,050 gross. You're thinking $1,050 profit. But the pickup is 100 miles away, the shipper is known for 8-hour detention (lost time: $280), fuel for 600 total miles at 6 mpg and $6.50 diesel is $650, and your baseline operating costs (truck payment, insurance, maintenance) come to another $330. Your actual result: a $210 loss for three days of work and a 100-mile deadhead.
The rate looked good. The math told a different story.
Owner-operators lose money this way for two reasons. First, they calculate profit in their head using only the loaded miles and gross rate, skipping the invisible costs. Second, they lack a system to test loads quickly before committing. Saying yes to five bad loads a month costs thousands in lost profit, and that damage compounds across a year of decision-making.
High rates attract you precisely because they look safe on the surface. But freight that pays $2.50 per mile on loaded miles but only $1.80 per mile on total miles (after deadhead, fuel, detention) is a trap. The industry calls these "highway robbery loads": impressive gross numbers hiding thin margins.
What to do next: On your next load, use your phone to text yourself three numbers: gross rate, total miles including deadhead, and actual hours spent waiting. At the end of the week, calculate your real per-mile profit. You'll build intuition for which lanes actually pay.
The Math Behind True Profitability: Rate Per Total Mile vs. Gross Rate
The single most important metric for load decisions is rate per total mile. Gross rate per loaded mile is a distraction; it's missing the entire picture.
Here's the distinction:
Gross rate per loaded mile = Load Payment / Loaded Miles Example: $1,500 / 500 miles = $3.00/mile (looks great)
Rate per total mile = Load Payment / (Loaded Miles + Deadhead Miles) Example: $1,500 / (500 + 100) = $2.50/mile (more realistic)
True net profit per mile = (Load Payment - Fuel - Other Expenses) / Total Miles Example: ($1,500 - $650 fuel - $330 operating costs) / 600 miles = $0.87/mile net
The difference between $3.00 per loaded mile and $0.87 per mile net profit is the entire business. Brokers know this and price accordingly. Loads with high rates often have low total miles because they're point-to-point hauls or because the deadhead to the pickup is significant.
Our approach to calculate load profitability starts with total miles, not loaded miles. We break down every expense separately so you see exactly what's eating your profit. Fuel cost, deadhead cost, detention time, and your baseline operating expenses all get their own line. The result is a clear net profit number and a rate per total mile that tells you whether the load is worth your time.
The formula for evaluating loads becomes simple: Accept loads where your rate per total mile exceeds your cost per mile plus a profit margin you can live on. Reject loads where it doesn't. That's the entire decision framework.
What to do next: Take a load you've already hauled and calculate all three numbers: gross rate per loaded mile, rate per total mile, and net profit per mile. Compare that to your target profit margin. If you need to make $1.00 per mile to cover costs and profit, but the load only pays $0.75 per mile net, you know why it felt tight even though the rate looked good.
What KRYSTAL Does That Load Boards Cannot
Load boards show available freight and pricing history. We built KRYSTAL Load Decisions to do the financial analysis that load boards cannot: take a specific load offer and calculate whether it's profitable for your specific truck and business.
When you paste a broker's load offer into KRYSTAL, our platform calculates:
- Your real cost per mile based on fuel prices, truck specifications, and operating expenses
- Deadhead cost and total mileage impact on profitability
- Net profit in dollars and cents, broken down by expense category
- Rate per total mile so you can compare apples to apples
- Lane and broker risk scoring based on historical data
- Reload likelihood at the delivery location
- A counter-offer target when the rate is too low
The difference is that KRYSTAL knows your business. You set your fuel cost, truck specifications, operating expenses, and profit goals. Every load analysis reflects your actual economics, not some industry average.
Load boards can't do this because they don't know the thousands of variables specific to your operation. KRYSTAL can because you tell us once, and we apply it to every load decision. The math happens in seconds, and you get a clear yes, no, or counter-offer recommendation before you pick up the phone.
What to do next: Open three load offers you've seen this week. Write down the gross rate and loaded miles for each. Now try to calculate your true net profit by hand. The exercise will show you why a tool that does this automatically saves time and prevents costly mistakes.
Building Your Operating Profile: The Foundation of Accurate Load Decisions
The accuracy of any load analysis depends on how well we understand your specific operation. We call this your operating profile, and it's the foundation of everything we do.
Your operating profile includes:
- Truck specifications: Engine type, empty weight, cargo capacity, fuel economy, and refrigeration unit efficiency (if applicable)
- Fuel cost: Real current or regional average fuel cost, not a guess
- Operating expenses: Your monthly or annual cost for insurance, truck payment, maintenance, taxes, permits, and any other fixed or variable costs per mile
- Target profit margin: How much per mile you need to make to justify running a load
- Preference data: The states you avoid and the markets where reloads are weak for you
Once you've set your profile, it applies to every load you analyze. When you paste in a new load offer, KRYSTAL calculates profitability using your numbers, not generic industry assumptions.

This is where most owner-operators falter. They know their truck payment and fuel cost, but they haven't calculated their total cost per mile. Insurance, maintenance, tires, and repairs all get lumped together in a vague "it's expensive to run a truck" feeling. When we ask you to be specific, you discover your actual cost per mile might be $2.10, not the $1.60 you assumed. That changes which loads make sense and which don't.
Building an accurate profile takes an hour the first time. After that, it takes two minutes to update when fuel prices shift or you change insurance carriers. The payoff is that every load decision you make is grounded in your real economics.
What to do next: Pull your last 12 months of P&L data. Add up every expense: truck payment, fuel, insurance, maintenance, tires, repairs, licensing, and anything else you paid out. Divide by your total miles for the period. That number is your true cost per mile. Write it down somewhere you can see it.
Using KRYSTAL to Evaluate a Load From Your Cab in Minutes
Real load decisions happen in the cab, not at a desk. A broker texts you a load offer. You have five minutes to decide. You can't afford to spend 20 minutes crunching numbers on a spreadsheet; you need an answer now.
That's why we designed KRYSTAL for speed. Here's how it works from your perspective:
- Broker sends a load offer: $1,250, pickup in Memphis, delivery in Dallas, 450 loaded miles.
- You open KRYSTAL and paste the details (or type them quickly).
- KRYSTAL applies the diesel price, truck specs and costs from your operating profile, and calculates:
- Deadhead from your current location (if you've logged it) - Fuel cost for the total miles - Your operating cost - Net profit - Rate per total mile
- You see a clear recommendation: Accept, Reject, or Counter at $X rate.
All of this happens in 90 seconds. You get the math, the recommendation, and the math explained clearly so you can explain it to your dispatcher or driver if needed.
The platform logs every load you analyze, whether you took it or not. Over time, you build a record of which loads and lanes were actually profitable, which brokers consistently underpay, and where your truck makes the most money. As you record how loads actually turned out, KRYSTAL adjusts its scores to your own results.
From the cab, you're no longer guessing. You're deciding based on your real numbers.
What to do next: Next time you get a load offer, calculate it three ways: using your current mental math, using a spreadsheet, and using our free load analysis (when you sign up). Compare the results. You'll see where your intuition is solid and where the numbers surprise you.
Lane Scoring and Broker Risk: Making Smarter Counter-Offers
A strong rate on a lane with bad reload odds is a different load than the same rate on a lane known for fast turnarounds and return freight. KRYSTAL scores lanes and brokers so you make better counter-offer decisions.
Lane scoring looks at:
- Historical reload likelihood: How likely a paying load is near the delivery location
- Detention history: What your own loads on the lane actually netted per mile and per hour, delays included
- Seasonal variation: Whether the lane is strong year-round or seasonal
- Typical rate ranges: Whether you have run or analyzed the lane enough times for the score to mean something
Broker risk scoring, built from your own completed loads with each broker, considers:
- Payment history: How many days does this broker typically take to pay?
- Load integrity: Do loads match the posted details, or are there surprises?
- Dispute rate: What percentage of loads end in disputes over pay or mileage?
- Volume and reliability: Is this a one-off or a consistent partner?
If a lane scores high for reloads, the effective rate per mile on a single load improves because you're likely to find paid freight for the return. If a broker scores poorly on payment history, the real cost of that load increases because you're financing their slowness.
These scores influence our counter-offer recommendations. If a broker on a good lane is low-balling you, we'll suggest a counter-offer at a rate you can justify. If a broker on a difficult lane tries the same tactic, the recommendation shifts. The lane dynamics matter as much as the gross rate.
What to do next: Make a list of your three most consistent brokers and three lanes where you run most often. For each broker, note how fast they pay and how often you dispute mileage or rate. For each lane, note how often you find return freight. You're building your own risk assessment; KRYSTAL systematizes it.
Comparing Real Economics Across Your Fleet
If you run more than one truck, the math changes for each one. A load paying $1.85 per total mile might work for a truck with a low cost per mile and lose money for one with a higher cost. Load decisions need to account for which truck is best positioned to haul which freight.
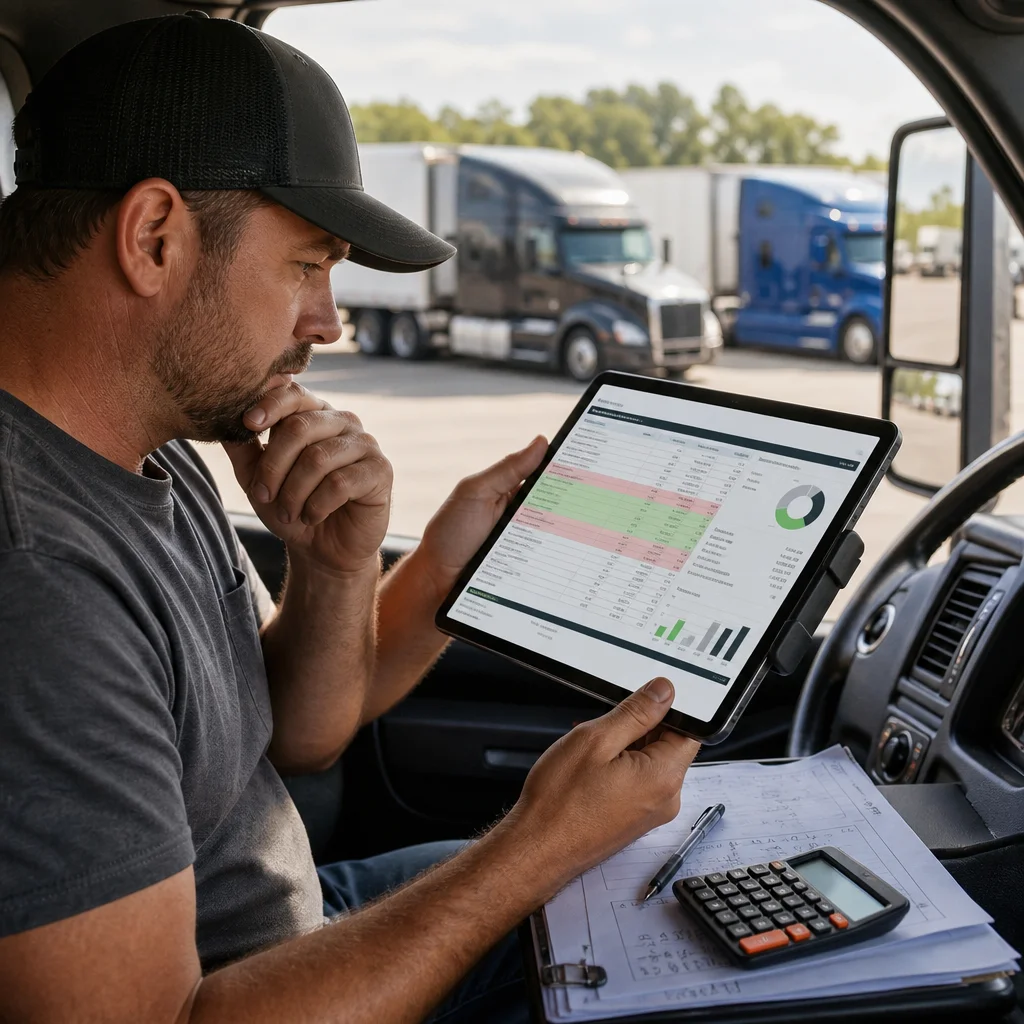
KRYSTAL supports fleet profiles. You set up an operating profile for each truck or unit type: dry van, reefer, flatbed, etc. Each profile includes its own fuel economy, operating costs, and capabilities. When you analyze a load, you pick the truck, and the result uses that truck's own costs.
A load with a tight margin on your standard dry van might have solid profit on a newer van with better fuel economy. A high-risk detention load might be worth it if it's going to your newest truck but not your aging one. Fleet economics require fleet-level visibility.
Comparing economics across your fleet also reveals which trucks are actually making money. You might discover that one truck is consistently running lower-margin loads because it's slower or less efficient, or that one driver gravitates toward better-paying lanes. This data drives dispatch decisions and helps you optimize which truck gets which load.
Over time, fleet operators who track this data make better asset decisions. You see which truck types deliver consistent profit and which ones are anchor loads. You understand where to invest when it's time to upgrade.
What to do next: If you run multiple trucks, calculate the cost per mile for each one separately. Include truck-specific fuel economy, maintenance costs, and insurance if it varies by unit. You'll probably find one truck is more efficient than you thought and another is a drain. That's where optimization starts.
Getting Started: Free Load Analyses Before You Commit
We offer approved owner-operators 15 free load analyses to test KRYSTAL before paying. This is long enough to evaluate a few loads, compare our recommendations to your current decision-making, and see whether the platform adds clarity and saves time.
During your free trial, you'll:
- Set up your operating profile (the one-time investment)
- Analyze 15 real load offers you get from brokers or load boards
- Compare KRYSTAL's recommendation to your gut decision
- See where the math confirmed your instinct and where it revealed blind spots
Spread your 15 free analyses over two or three weeks of real offers so you see the system working on realistic freight. You'll discover which load types KRYSTAL flags as problematic and whether the counter-offer recommendations align with your experience.
After your trial, our pricing is flat and simple: $70/month for 1-3 trucks, scaled by fleet size. That's unlimited load analyses, unlimited team logins for owner, dispatcher, and driver, and performance logging that builds your decision track record month after month.
The math is straightforward. If KRYSTAL helps you turn down one bad load a month that would have cost you $300 in hidden losses, that alone covers the $70 monthly fee four times over. If it helps you negotiate better counter-offers on 10 loads a month at an extra $50 per load, you're adding $500 a month to your bottom line.
To get started, request a demo. Once you're approved, you set up your operating profile and get your 15 free analyses. You'll be analyzing your first load in minutes.
What to do next: This week, identify three loads you're considering. Before you decide, run them through the free cost per mile calculator, or through KRYSTAL once you're approved. Write down what your instinct says and what our math says. Compare them at the end of the week. If KRYSTAL's recommendations would have saved you money or made you more, you've found your decision tool.
The work of calculating true load profitability doesn't have to be hard. The math is straightforward once you separate gross rate from real profit. Our job is to make that math automatic so you can make better decisions from your cab in seconds instead of guessing and hoping for the best.
For further reading: KRYSTAL platform overview.
Frequently Asked Questions (FAQ)
How do I know if a load actually pays after deadhead, fuel, and my costs?
We built KRYSTAL specifically for this problem. You paste in a broker's load offer, and we calculate your real cost per mile by factoring in deadhead miles, fuel burn at the diesel price in your profile, your own operating expenses, and the total mileage you'll actually drive. Our report shows you the net profit, not just the gross rate, so you can make a yes-or-no decision from the cab in minutes with the math visible.
What makes KRYSTAL different from using load boards like DAT?
Load boards show you the gross rate per loaded mile, but that hides whether you'll actually make money once you drive empty miles to pick up the load and burn fuel getting there. We work alongside DAT and Truckstop by filling the gap they can't close: we tell you what the load pays per total mile and what your profit margin actually is. We also score broker reliability and reload odds at the delivery, then suggest a counter-offer target if the rate is too low.
How much does KRYSTAL cost, and do I have to commit long-term?
We charge a flat monthly rate based on your fleet size, starting at $70 per month for 1-3 trucks, with no contracts. We also give approved owner-operators 15 free load analyses so you can test our math against loads you've already accepted and see if our numbers check out before you pay anything.