

Table of Contents
- Why Revenue Numbers Lie to Owner-Operators
- The Hidden Cost of Accepting the Wrong Loads
- Real Cost Per Mile: Your True Operating Baseline
- How Deadhead Miles Destroy Your Profit Margin
- Rate Per Total Mile vs. Rate Per Loaded Mile
- The Counter-Offer Strategy That Protects Your Bottom Line
- Building a Monthly Profit Target and Sticking to It
- How to Use Load Analysis to Make Faster Decisions
- Fleet-Wide Profit Tracking for Owner-Operators
- Your Next Step: Analyze Your Current Loads
- Frequently Asked Questions (FAQ)
Why Revenue Numbers Lie to Owner-Operators
The dispatcher's message lands in your phone: a 485-mile load, quoted at $1,450. Your first instinct is to say yes. That's a solid gross number. But then the math hits you. After fuel, deadhead back home, insurance, and truck payment, you're looking at maybe $250 in actual profit. You've just spent 10 hours for money that doesn't move the needle on your bottom line.
This scenario plays out every week across the industry. The gap between revenue and profit is where most truckers lose money without realizing it. We built KRYSTAL because we saw owner-operators making decisions on incomplete information, accepting loads that looked good until they did the math in the parking lot three hours later.
Maximizing net income isn't about chasing every high-dollar load. It's about knowing your true operating costs, understanding what each load actually pays after everything is deducted, and having the confidence to say no or counter when a rate doesn't stack up. Let's walk through the framework that changes how you evaluate freight.
A load quoted at $2.70 per mile looks completely different when you factor in 120 empty miles back to your home base. That $2.70 becomes $1.69 per total mile once deadhead is included. The broker didn't lie. They quoted you the loaded rate, which is their standard. But standard doesn't mean profitable for you.
Brokers, load boards, and dispatchers show gross revenue because it's their job to fill trucks. They're not calculating your insurance, your fuel surcharge, your truck payment, or your time spent sitting at a shipper. Those costs are invisible to them. Your job is different. You're optimizing for profit, which means every number you see needs to be run through your actual cost structure.
Some owner-operators only find out after delivery that the payout didn't justify the fuel burn. Others accept loads, run them, and only then realize the profit margin was razor-thin. Both outcomes waste time and create stress. The fix is simple: evaluate every load against your real operating costs before you commit.
Start tracking what you actually spend to move a mile. This isn't guesswork. Pull three months of records: fuel receipts, insurance statements, maintenance logs, truck payment or lease statements, and any licensing or compliance fees. Divide total expenses by total miles driven. That number is your true cost per mile and the foundation for every load decision you'll make going forward.
The Hidden Cost of Accepting the Wrong Loads
Accepting a marginally profitable load creates a cascade of lost opportunity. Those 10 hours and 485 miles could have been spent repositioning to a better freight lane, waiting for a higher-paying load, or servicing an existing customer who always books quality freight. Instead, you're sitting in the parking lot at delivery, with a low-profit run completed and limited reload options.
The cost of a bad load decision compounds. If you run three mediocre loads a week at $400 profit each, you're netting $1,200 weekly. Three good loads at $800 profit each gets you to $2,400 weekly. The difference isn't in the gross revenue or mileage. It's in the selectivity. Saying no to bad loads and waiting for good ones usually pays better than chasing volume.
Insurance and truck payment remain fixed whether you're running $400-profit loads or $800-profit loads. Fuel costs rise and fall, but they're nearly proportional to miles. The margin between profitability and just covering expenses is often a single load decision per day. One bad load a week, at a few hundred dollars of profit you could have kept, adds up to well over $10,000 a year.
Risk also increases with low-margin loads. If a shipper delays you by four hours, or a broker disputes the load weight, or you get a scale fine, a marginal load becomes a money-losing run. High-margin loads have built-in buffer. They can absorb operational friction and still be profitable. Build your decision-making around that reality.
Real Cost Per Mile: Your True Operating Baseline
Your cost per mile is the number that makes or breaks load profitability. It's not a fixed value across all trucks, all seasons, or all driver situations. A new truck with a steep payment carries a higher cost per mile than a paid-off truck. Winter fuel costs are higher than summer. A loaded truck getting 5.5 miles per gallon has a different cost structure than one running 6.5.
We recommend calculating your cost per mile monthly and reviewing it quarterly. This keeps the number responsive to real changes in your business. Pull these categories: fuel, maintenance and repairs, tires, insurance, truck payment or lease, licensing and compliance, tolls, supplies, and any driver wages if you're running multiple trucks.
Here's the breakdown:
- Fuel: Total spent divided by total miles. Track this to the gallon if possible.
- Maintenance and repairs: Average monthly spend divided by average miles per month.
- Tires and wheels: Prorated replacement cost plus any puncture repairs.
- Insurance: Monthly premium divided by average miles.
- Fixed payments: Truck loan, lease, or owner operator insurance divided by average miles.
- Licensing: Annual DOT, IFTA, and state permits divided by annual miles.
- Tolls and scales: Monthly average divided by miles.
- Supplies: Chains, lights, oil, logs, cleaners, and miscellaneous per-month spend divided by miles.
Once you have the total, you've found your baseline. If your cost per mile is $2.10, then a load quoted at $2.40 per loaded mile doesn't work unless there's a strong reload or the deadhead is minimal. A load quoted at $2.90 per loaded mile with short deadhead and good reload odds becomes interesting.
How Deadhead Miles Destroy Your Profit Margin
Deadhead is the silent killer of owner-operator profit. A 300-mile load paying $2.70 per mile looks like $810 gross. But if you deadhead 150 miles back to the freight lane or to a shipper you work with regularly, your total miles are 450. That $810 now pays $1.80 per total mile. Against a cost per mile of $2.10, you're losing $0.30 a mile, $135 in total, on a run that took most of a day.
Brokers and load boards don't always disclose deadhead costs upfront. Some do, some don't. That's why we built KRYSTAL to handle this math automatically. Paste in the load details, and the tool calculates your deadhead scenario, showing you the profit impact before you decide.
Owner-operators who manage deadhead strategically keep more of what they gross than those who ignore it. The best loads are often those with built-in reload opportunities at or near the destination. A load that pays $2.40 per loaded mile but has a 70% reload likelihood at the drop is far more valuable than a $2.70 per loaded mile load with zero reload odds that requires 200 miles of deadhead back to freight.
When evaluating any load, ask these questions:
- What's the deadhead distance back to a viable freight source?
- Is there a likely reload at this destination? Check load board activity or call shippers directly.
- How long will repositioning back to freight take, and what's the fuel cost?
- Could I take this load, grab a reload, and build a profitable round trip?
If you can't answer these questions in minutes, you don't have enough information to say yes. Push back on brokers for reload intel or skip the load.
Rate Per Total Mile vs. Rate Per Loaded Mile
This distinction is critical and where many owner-operators make their biggest errors. Brokers quote rate per loaded mile. It's their standard metric. But you operate on total miles, including deadhead, waiting time, and unloading delays. These miles still cost you fuel and have an implicit time cost that could be spent on a better load.
Let's use concrete numbers. Load A is quoted at $2.75 per loaded mile for 400 miles. Load B is quoted at $2.45 per loaded mile for 400 miles. Load A looks better, and it is, unless deadhead enters the picture. Load A requires 180 miles of deadhead to get back to productive freight. Load B has a 90% reload likelihood at destination.
Load A: 400 loaded miles at $2.75 = $1,100 gross. Add 180 deadhead miles at no revenue = 580 total miles. Rate per total mile = $1.90. At $2.10 cost per mile, that's a $118 loss.
Load B: 400 loaded miles at $2.45 = $980 gross. With a reload, you don't deadhead. Rate per total mile = $2.45. At $2.10 cost per mile, profit is $140.
Load B makes money and Load A loses it, despite Load B's lower quoted rate, because the calculation includes the full operational picture. Rate per total mile forces you to account for empty miles in your decision.

When comparing loads, always convert quoted rates to rate per total mile. This puts every option on the same footing and prevents you from chasing gross revenue numbers that don't translate to profit.
The Counter-Offer Strategy That Protects Your Bottom Line
Not every load at the quoted rate is worth your time. But some loads, with a higher rate, become compelling. The question is: what rate do you need to say yes?
Start with your cost per mile plus your target profit margin. If your cost is $2.10 per mile and you want to net $0.50 per total mile, you need $2.60 per total mile. If a load is quoted at $2.35 per total mile (after accounting for deadhead), you have a counter-offer target: roughly $2.60 to $2.65 per total mile.
Many brokers expect pushback. They build negotiation room into their initial quotes. Counter-offering isn't rude. It's standard practice. The key is making your counter grounded in real costs, not arbitrary. We calculate this automatically in our load analysis reports, showing you the exact counter-offer target for any load.
Before you counter, know your walk-away number. If the broker won't meet your target rate, you're ready to decline. This discipline prevents you from accepting marginal loads just because you've invested mental effort in the negotiation.
A strong counter conversation sounds like this: "That load works if you can do $2.62 per total mile. At $2.35, the fuel burn and my deadhead back to freight don't leave me enough margin. Can you get closer to $2.62?" You're professional, you're grounded in the math, and you're negotiating from strength. Many brokers will meet you closer to your target or find a better load to offer.
Building a Monthly Profit Target and Sticking to It
Revenue goals and profit goals are not the same. An owner-operator might gross $4,500 per week and feel successful until tax time when they realize their profit was barely $1,200. Flipping that mindset requires a monthly profit target and discipline to hit it.
Start by calculating your monthly fixed costs: truck payment, insurance, licensing, and any recurring maintenance reserve. If that number is $2,500, you need to net $2,500 before you break even, and more than that to actually profit. Add your desired personal income. If you want to net $2,000 profit after expenses, your monthly target is $4,500.
Now work backward. If your average load nets $350 after all costs, you need roughly 13 profitable loads per month. If you're running five days a week, that's about three loads a week. That becomes your weekly target. Some days you'll run two high-margin loads and nail it. Other days you'll only find one load that meets your criteria and you'll wait for the next day's opportunities.
This discipline prevents emotional decision-making. On a slow Tuesday when loads are thin and rates are weak, you'll be tempted to take a marginal load just to move the truck. Your monthly target reminds you that one bad load costs you more in foregone profit than a few hours of waiting costs you in downtime.
Review your monthly profit each month, not quarterly or annually. Adjust your strategy if you're consistently missing your target. Maybe your cost per mile estimate was too low, or your target profit is unrealistic for your market. Better to find out by month three and adjust than to operate the whole year on a flawed plan.
How to Use Load Analysis to Make Faster Decisions
When you're in the cab and a broker sends a load, you have maybe five minutes to decide. Running spreadsheets or pulling out a calculator isn't practical. You need a system that gives you a yes, no, or counter-offer in seconds, backed by clear math.
That's why we created KRYSTAL. Paste in the broker's load details, and the tool instantly shows your cost breakdown, net profit, rate per total mile, lane risk, reload likelihood, and a counter-offer target if needed. No guesswork. No second-guessing. Just clear numbers that tell you whether the load moves you toward your monthly profit target or away from it.
The goal is a load reviewed in under a minute instead of ten minutes of mental math that still leaves you uncertain. The speed isn't just convenience. It's strategic. Decisions made faster with better data mean you're accepting loads from the strongest brokers and the best freight lanes while competitors are still thinking about it.
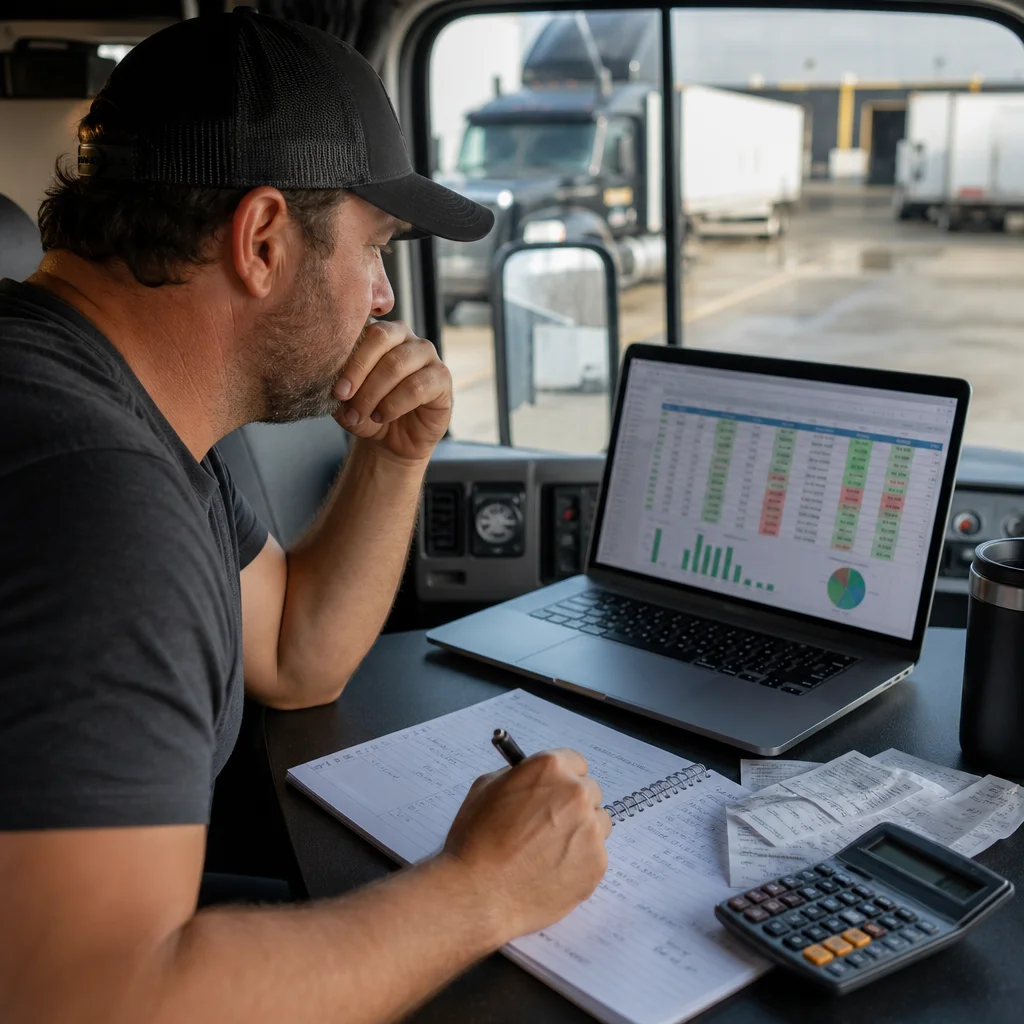
Load analysis also reveals patterns. After analyzing 20 or 30 loads, you'll see which brokers consistently offer good rates, which lanes pay better, and which times of week have better freight available. That insight helps you proactively reach out to good brokers and avoid wasting time on weak ones.
Fleet-Wide Profit Tracking for Owner-Operators
If you run more than one truck, load analysis becomes even more critical. You might think your best driver is running the most profitable loads, but without actual numbers, you're guessing. Load analysis logging and reporting show you exactly which trucks, which drivers, and which freight lanes are most profitable.
We track every analyzed load for owner-operators on our platform, with a weekly summary and reports that show average profit per load, loads analyzed vs. loads accepted, and which brokers delivered the best margins. When you run three trucks, you can see that Truck A averages $520 profit per load while Truck B averages $380. That difference tells you something: maybe Truck B's driver needs coaching on rate negotiation, or maybe Truck B is assigned to a weaker freight lane than Truck A.
Fleet-wide tracking also helps you optimize dispatch. If you have multiple driver-trucks and a strong load comes in, you'll know which truck to assign it to based on historical performance. Over time, you'll route your strongest drivers and best-performing trucks to the most profitable freight lanes, multiplying the effect of good decision-making across your fleet.
Owner-operators running two to three trucks see this most clearly. Without load analysis, fleet management is seat-of-the-pants guessing. With it, you have data. That data lets you coach drivers, adjust incentives, and allocate resources with confidence.
Your Next Step: Analyze Your Current Loads
Start today. Pull five to ten of your recent load offers (the ones you accepted and the ones you declined). Run them through our load decisions for owner-operators tool and see what the actual profit math shows. You might find that loads you felt good about were actually marginal, or that you left significant profit on the table by accepting a rate that was below your counter-offer target.
Approved operators get 15 free load analyses as a starting point. Use those to build your baseline understanding of your own profitability and test whether our platform's calculations match your instincts. They often do, but seeing the math spelled out changes how you think about every load decision going forward.
Once you've run a handful of loads, you'll have clarity on your true cost per mile, your profit margin per average load, and what your monthly profit target actually requires in daily decisions. That clarity is the foundation for consistent, sustainable income growth. It's the difference between hoping you had a good month and knowing exactly how much you made and why.
For further reading: Freight decision tool.
Frequently Asked Questions (FAQ)
How do we calculate the real profit on a load?
We analyze every expense that cuts into your earnings: fuel consumption, deadhead miles, loading and unloading time, and your own cost per mile based on your truck's operating costs. When you paste a broker's load offer into KRYSTAL, our engine breaks down the rate per total mile (loaded plus deadhead), subtracts your actual expenses, and shows you the net profit before you commit. This is what separates the loads that look good from the loads that actually pay.
Why does rate per loaded mile mislead owner-operators?
A load that pays $2.50 per loaded mile sounds solid until deadhead gets factored in. If you deadhead 200 miles to pick up and the load is 400 miles, your rate per total mile drops significantly, and so does your real profit. We show you both figures side by side so you see the complete picture and can decide whether the load is worth your time and fuel.
What should we counter-offer when a rate is too low?
We calculate your counter-offer target automatically based on your cost per mile, the total miles involved, and the lane risk. Instead of guessing or accepting a bad rate, you'll know exactly what you need to ask for to hit your profit goals. Our counter-offer feature removes the guesswork and gives you a number you can justify to the broker in seconds.